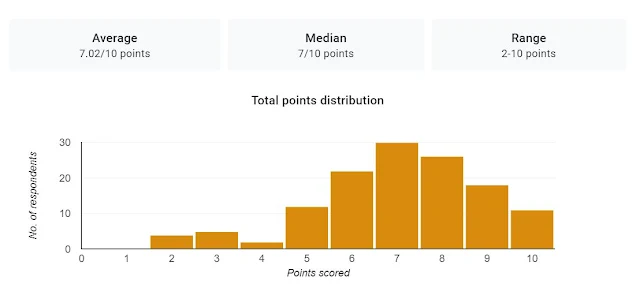
GARP SCR 2024 Utilize the Test Score Distribution Chart to Benchmark Your Performance
- Get link
- X
- Other Apps
Dear Readers,
As part of our ongoing commitment to providing valuable insights and support to our community, I have compiled a comprehensive quiz score distribution charts for the 8 different practice quizzes (one for each chapter). These charts encompass a diverse range of scores from various individuals within our community including the ones who appeared for October 2023 exam. Scores distribution is as of 5th Feb'24.
I believe that benchmarking your own test scores against this distribution can offer valuable insights into your performance and areas for potential improvement. Understanding where you stand in comparison to your peers can be a powerful tool for setting realistic goals and developing strategies for academic or professional growth.
To access the test score distribution chart, please take a moment to locate your score on the chart and consider how it aligns with the broader distribution. This exercise can help you gauge your relative standing and identify areas where you may excel or need additional focus.
Remember that benchmarking is not about comparison or competition; rather, it is a tool for self-assessment and improvement. I encourage you to use this chart as a starting point for meaningful reflection on your strengths and areas for development.
If you have any questions or need assistance interpreting the chart, please feel free to reach out to me. You can leave a comment. I am here to support you on your journey towards continued success.
Thank you for being a valued member of our community, and we look forward to hearing about your insights and reflections after utilizing the test score distribution chart.
Quiz#1 score distribution (below)
Quiz#2 score distribution (below)
Quiz#3 score distribution (below)
- Get link
- X
- Other Apps


.png)

.png)

Comments
Post a Comment
Please share your thoughts here. If possible, please share your name and email so that it is easy to connect.