GARP SCR: Interesting questions Set2
Q1. What are practical examples of attention deflection and attention decoupling?
Here are two examples or scenarios for each of attention deflection and attention decoupling in the context of greenwashing:
Attention Deflection:
1. Cosmetic Company's "Natural" Packaging:
- Scenario: A cosmetics company markets its products in packaging adorned with images of lush forests and green leaves. They prominently feature the term "natural" on the packaging to give the impression that their products are environmentally friendly.
Attention Deflection: By focusing on the natural imagery and packaging, the company diverts consumers' attention from the fact that the actual product ingredients may include harmful chemicals, and the manufacturing process may have a significant environmental impact.
2. Fast Food Chain's "Sustainable" Utensils:
- Scenario: A fast-food chain proudly advertises its use of "sustainable" utensils and claims to be reducing plastic waste. They highlight the switch to biodegradable forks and spoons.
- Attention Deflection: By emphasizing the sustainable utensils, the fast-food chain deflects attention away from the fact that their core menu items are often associated with excessive packaging, unhealthy ingredients, and unsustainable agricultural practices.
Attention Decoupling:
1. Oil Company's Green Energy Subsidiary:
- Scenario: A major oil company creates a separate subsidiary that focuses on renewable energy solutions, such as wind and solar power. The subsidiary is branded as environmentally conscious and highlights its commitment to a sustainable future.
- *Attention Decoupling*: While the subsidiary promotes green energy initiatives, the parent company continues its fossil fuel extraction and production activities, which are environmentally damaging. This separation decouples the company's sustainable image from its core, unsustainable operations.
2. Automaker's Electric Vehicle Division:
- Scenario*: An automobile manufacturer establishes an electric vehicle (EV) division, producing electric cars and touting their commitment to reducing emissions and environmental impact.
- Attention Decoupling: Despite the EV division's environmental focus, the parent company's primary business still revolves around manufacturing gasoline-powered vehicles that contribute to pollution and greenhouse gas emissions. The company decouples its sustainability efforts in EVs from its overall carbon-intensive operations.
These examples illustrate how attention deflection and attention decoupling can be employed to create a perception of environmental responsibility while diverting attention from less sustainable aspects of a business.
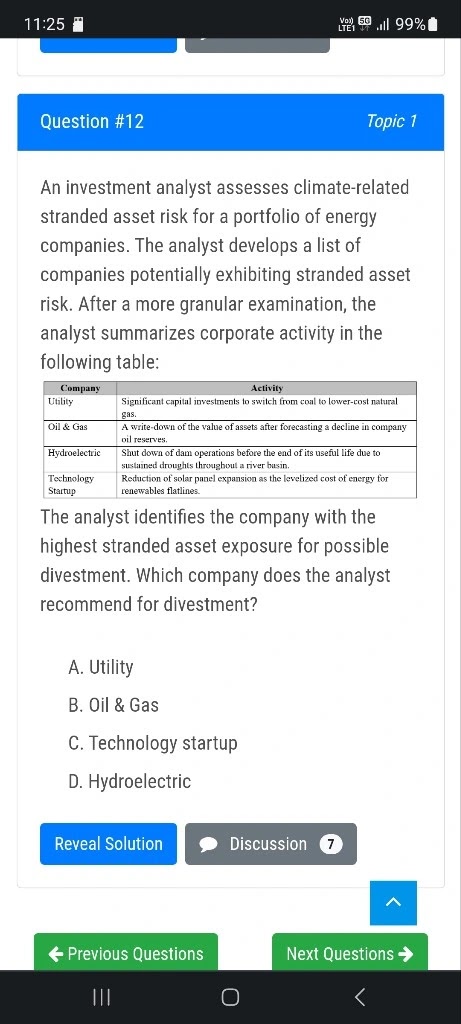
Q2. Question is as per the image below (Question posed by Adil Rezza, one of the group member in the linked group:https://www.linkedin.com/groups/12842133/)
Answer:
Seems to be Utility as you are investing heavy amounts from moving from one fossil fuel with higher emissions to another with lower emissions..but it is still fossil fuel (gas). Natural gas investments will still be impacted by transition risk. Suppose if same amount was invested in coal power plant and in hydroelectric power plant. Now, few years later some additional amount in power plant to move from coal to gas. If you see, investment in fuel power is at a higher risk than hydroelectric.
Q. What is the difference between both metrics (carbon intensity and weight averaged carbon intensity). (Question posed by one of our Singapore-based group member in the linked group:https://www.linkedin.com/groups/12842133/)
Explained below with numerical examples
Here are is a numerical example for each metric: carbon intensity and weight-averaged carbon intensity.
1. Carbon Intensity:
- Let's calculate the carbon intensity of energy production for a country. Suppose this country produces 100,000 MWh of electricity, emitting 300,000 metric tons of CO2e in the process.
Carbon Intensity of Energy Production = (Carbon Emissions in CO2e) / (Energy Production)
Carbon Intensity of Energy Production = 300,000 metric tons CO2e / 100,000 MWh
Carbon Intensity of Energy Production = 3 metric tons CO2e per MWh
This means that, for every megawatt-hour (MWh) of electricity produced in this country, there are 3 metric tons of CO2e emissions.
2. Weight-Averaged Carbon Intensity:
- Let's consider a product's life cycle assessment. The product goes through three stages: raw material extraction, manufacturing, and transportation, each contributing to its total carbon emissions.
- Assume the following:
- Raw material extraction: 2,000 kg of CO2e emissions, representing 30% of the total emissions.
- Manufacturing: 3,500 kg of CO2e emissions, representing 50% of the total emissions.
- Transportation: 1,000 kg of CO2e emissions, representing 20% of the total emissions.
Weight-Averaged Carbon Intensity = (Carbon Intensity of Raw Material Extraction × Weight of Raw Material Extraction) +
(Carbon Intensity of Manufacturing × Weight of Manufacturing) +
(Carbon Intensity of Transportation × Weight of Transportation)
Weight-Averaged Carbon Intensity = (2,000 kg × 0.30) + (3,500 kg × 0.50) + (1,000 kg × 0.20)
Weight-Averaged Carbon Intensity = 600 kg + 1,750 kg + 200 kg
Weight-Averaged Carbon Intensity = 2,550 kg
The weight-averaged carbon intensity for this product's life cycle is 2,550 kg of CO2e emissions per unit of the product.This example illustrates how the weight-averaged carbon intensity considers the contribution of each stage (with different emissions) weighted by their share in the total carbon emissions.
Q. What hazards beyond sea level rise can cause physical climate risks? click all that applies.
A. Deforestation
B. Hurricanes
C. Droughts
D. Earthquakes
E. Agriculture productivity
------------------- Think! ---- Think! ------------------------------
Answer: B,C,E. Please note "Agriculture productivity" is a type of physical risk. (Reference: Figure 6.2 of the text book)
Q. Question is as per the image below (Question posed by Riddhi Dharod, one of the group member in the linked group:https://www.linkedin.com/groups/12842133/)
Answer : Correction option should be "D".
Below is the explanation to answer "D".
Please note always look out for the word "abrupt" along with the physical risk (like natural disasters) in order for the physical risk create liquidity risk. Please note the below portions from the chapter 6.


.png)

Thanks, this is really helpful!
ReplyDeleteMost welcome. I am glad that you found the information useful for your exam preparation
Delete