Posts

Showing posts from October, 2023

Welcome to GARP SCR PREP BLOG!

Image
Please scroll down to view the searched post. Banner image to all the posts is added to celebrate success of my LinkedIn members who cleared the GARP SCR Exam!  LinkedIn community link: https://www.linkedin.com/groups/12842133/                                                                                                                                                                                                                                                    

GARP SCR: Sharing exam preparing experience October 2023

Image
GARP SCR: Sharing exam preparing experience October 2023 Collecting your feedback is to inspire and motivate future aspirants of GARP SCR exam aspirants. They can learn from your experience as they start preparing. It may not take long for you to share your feedback, but it will go a long way to help future aspirants. How to leave a feedback? 1. It is a simple board - no need to sign-in etc.  2. You can either click the green plus sign (as shown in red color) to add a new topic  OR  you can click a vote up by clicking a small black "+" sign on bottom left (as shown in blue circle) . I have already added some additional card like the one shown here. You can overwrite the text there.  3. If you are adding a new topic, please add your name First name, may be first letter of your last name and Country from where you are .  4. Please use one card for one topic. You can add as many topics or cards as you want to. 4.  Please share your comment on the all questions. Cu

Quiz#9 : GARP SCR : Test Your Understanding with a FREE Quiz of mixed bag questions

Image
Quiz#9 : GARP SCR : Test Your Understanding with a FREE Quiz of mixed bag questions   A brand new exciting quiz for you! This quiz contains questions from different chapters.  Most of them involve calculations. Please keep a calculator ready. You will find some interesting questions to tackle. Please feel free to share your feedback. Ready for the exam then? Click on this    link to take the short exam  

GARP SCR: Interesting questions Set2

Image
GARP SCR: Interesting questions Set2 Q1. What are practical examples of  attention  deflection and  attention  decoupling? Here are two examples or scenarios for each of  attention  deflection and  attention  decoupling in the context of greenwashing: Attention  Deflection: 1.  Cosmetic Company's "Natural" Packaging:    - Scenario: A cosmetics company markets its products in packaging adorned with images of lush forests and green leaves. They prominently feature the term "natural" on the packaging to give the impression that their products are environmentally friendly.      Attention  Deflection: By focusing on the natural imagery and packaging, the company diverts consumers'  attention  from the fact that the actual product ingredients may include harmful chemicals, and the manufacturing process may have a significant environmental impact. 2.  Fast Food Chain's "Sustainable" Utensils:    - Scenario: A fast-food chain proudly adve

GARP SCR: Climate impacted PD curve shifts to right

Image
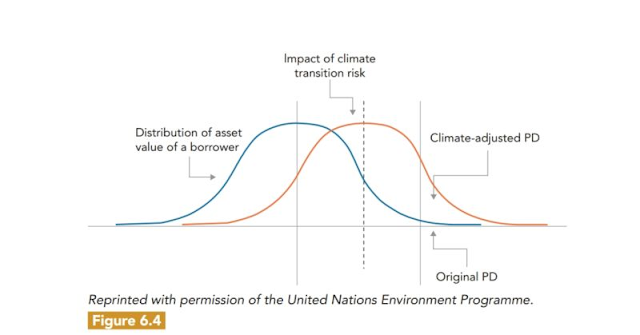
GARP SCR: Climate impacted PD curve shifts to right This is a very interesting question posed by Valentina Ricciuti (group member of the Linkedin group https://www.linkedin.com/groups/12842133/)  related to Probability of default (PD) curve as shown in the below diagram. She asks as to why the PD curve shifts to the right due to climate change impact.  (Below image is from Chapter#6)                                                               Figure from Chapter#6 Below is the explanation in 3 simple figures Figure 1: PD curve without the climate change The graph in Figure 1 is a histogram of the count of defaulting loans – say a home loan or a home mortgage - date collected by the bank over a period of 2000-2010. On the X-axis or horizontal axis, there are some categories like -25%, -5%, 0 %, 5%, 25% etc..  Consider this curve to without climate change Example: 5% represents a category where 5% of home loans were defaulted, similarly 10% represents a category where 10%

GARP SCR: Understanding BASIC and BASIC+ (Part 2/2)

Image
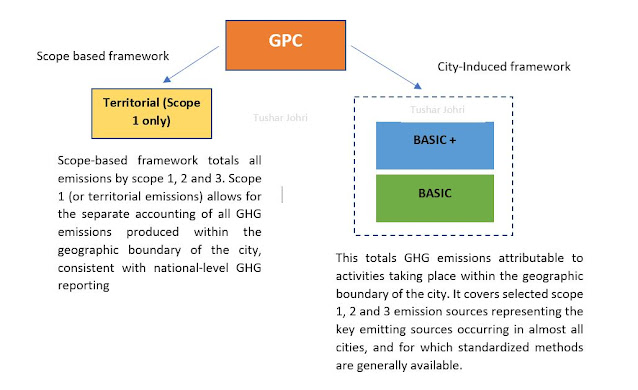
GARP SCR: Understanding BASIC and BASIC+ Part 2 of 2 This is the 2nd part of the article. in case, you have NOT read the 1st part of the article. You can read the 1st part of the article here (click here) . In the 2nd part of the article on understanding GPC BASIC and BASIC+, we will go into the details of the frameworks defined by GPC. So, how does the report structure look like using both the above frameworks? Here it is.  Let us focus more on BASIC and BASIC +                                                                                BASIC + BASIC Stationary energy Yes Yes Transportation Yes Yes Waste Yes Yes AFOLU Yes - IPPU Yes - Below table shows the details with sectors and sub-sectors and what all emissions are reported under each scope. The table is worth studying and identifying various interesting trends to take a note of. These trends will help you understand the way accounting and reporting is done under BASIC and BASIC+. Shall we start noting down th

GARP SCR: Understanding BASIC and BASIC+ (Part 1/2)

Image
GARP SCR: Understanding BASIC and BASIC+ Part 1 of 2 This article is about describing BASIC and BASIC+.   This post was to share more information on the topic as was discussed with  Natascha Rüeger . She is one of the group member on the LinkedIn group( https://www.linkedin.com/groups/12842133/).  Like all the other topics, she was trying to get a deeper understanding of the topic. This also gave me good reason to research this topic. I have tried to describe the information by striking a balance between the length of the article and clarity that it should impart. Thanks to Natascha again for her keen interest in the topic. This article assumes that the reader has a background about different “Scopes” of emissions as defined by The Greenhouse Gas Protocol .     This article is going to be split into 3 parts for better understanding. Getting Started Consider a city mayor entrusts a team to create an emissions report for the entire city. Like for any other report, bel

GARP SCR: Understanding Albedo effect

Image
GARP SCR: Understanding Albedo effect  This question was first posed by one of the group member Divya Papneja from the Linkedin group (https://www.linkedin.com/groups/12842133/).  The Albedo effect, also known as Albedo, refers to the measure of the reflectivity or reflective properties of a surface. It quantifies how much of the incoming solar radiation (sunlight) is reflected back into space, as opposed to being absorbed by the surface. Albedo is typically expressed as a percentage, with 0% indicating perfect absorption (all incoming radiation is absorbed), and 100% indicating perfect reflection (all incoming radiation is reflected). (Although various components of the Earth's surface display huge variable ranges in the amount of light they absorb or reflect, the global average reflectance/absorption of Earth, known as Albedo, has remained constant at ~31%. KEN GOULD, NEW YORK STATE REGENTS EARTH SCIENCE. Source:Forbes) To put it simply, the whiter the surface is, h